Case Study
Digitising Heavy Industry: A High-Trust Interface for IoT Power Systems
A responsive HMI (Human-Machine Interface) that bridges the gap between physical reliability and digital control. Designed to handle API latency and build trust with field engineers.
Role
UX Designer (Hybrid)
Tech Stack
JS, JQuery, ThingSpeak API, Figma, Bootstrap 5, Chart.js
Phase 1
Discover (Insight)
Participant Observation
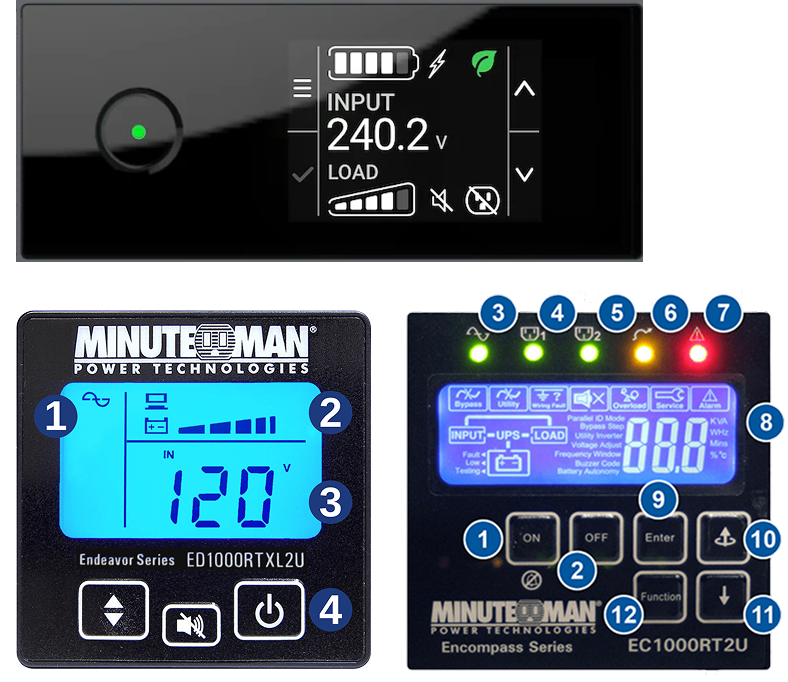
Worked hands-on as a temporary junior electrical engineer testing DC breakers. This direct participant observation allowed me to experience the tactile environment firsthand and deeply empathise with the engineers' reliance on physical feedback.
Iterative Focus Groups
Conducted multiple focus group sessions with field engineers to collaboratively define the core project challenge and uncover deeply rooted operational pain points.
Phase 2
Define (Focus)
Design Challenge
The field work and sessions helped us pinpoint the physical-digital gap. The digital UI had to feel as trustworthy as tactile switches.
Problem Identification
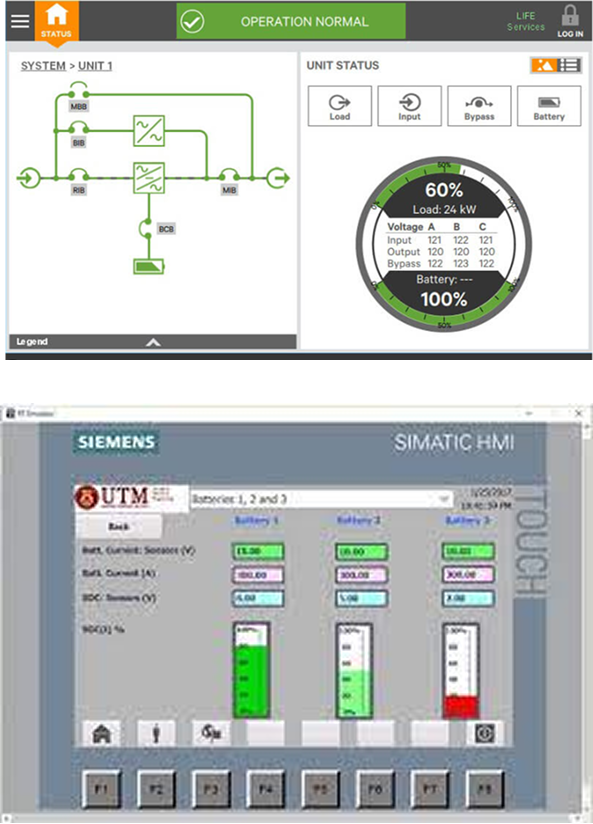
Through these iterative discussions and hands-on testing, we identified that a lack of clear digital feedback left users unsure if commands were successfully executed, creating severe 'interaction anxiety'.
"How might we design a digital interface that provides the same level of immediate reassurance and trust as tactile industrial hardware?"
Phase 3
Develop (Solutions)
Design Metaphors
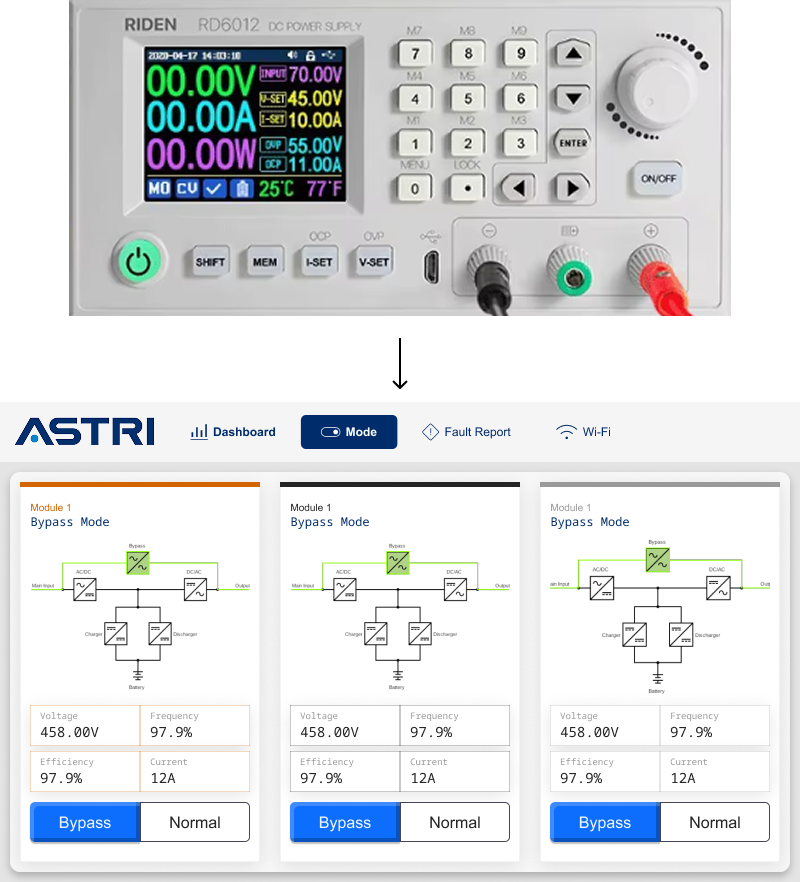
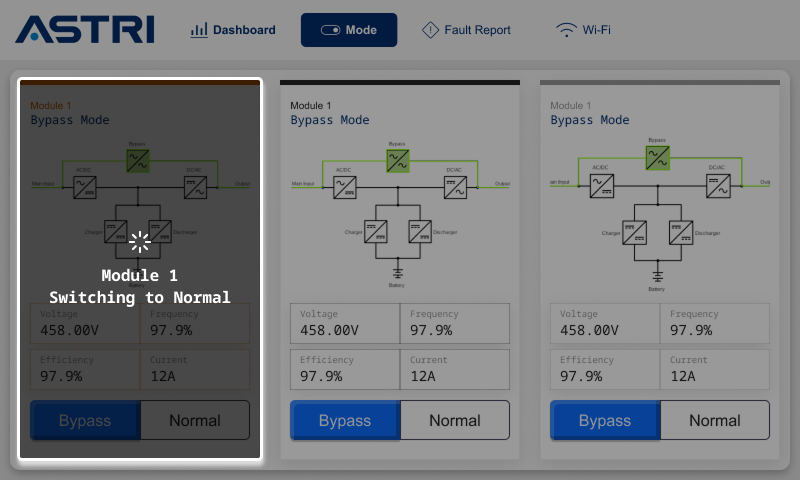
Emulated physical cues like toggle travel and state depth. To mimic physical hardware, I designed buttons to transition from a plain unactivated style to a full-color active state, replicating exactly how a real industrial switch lights up when pressed.
Clarity Over Decorative
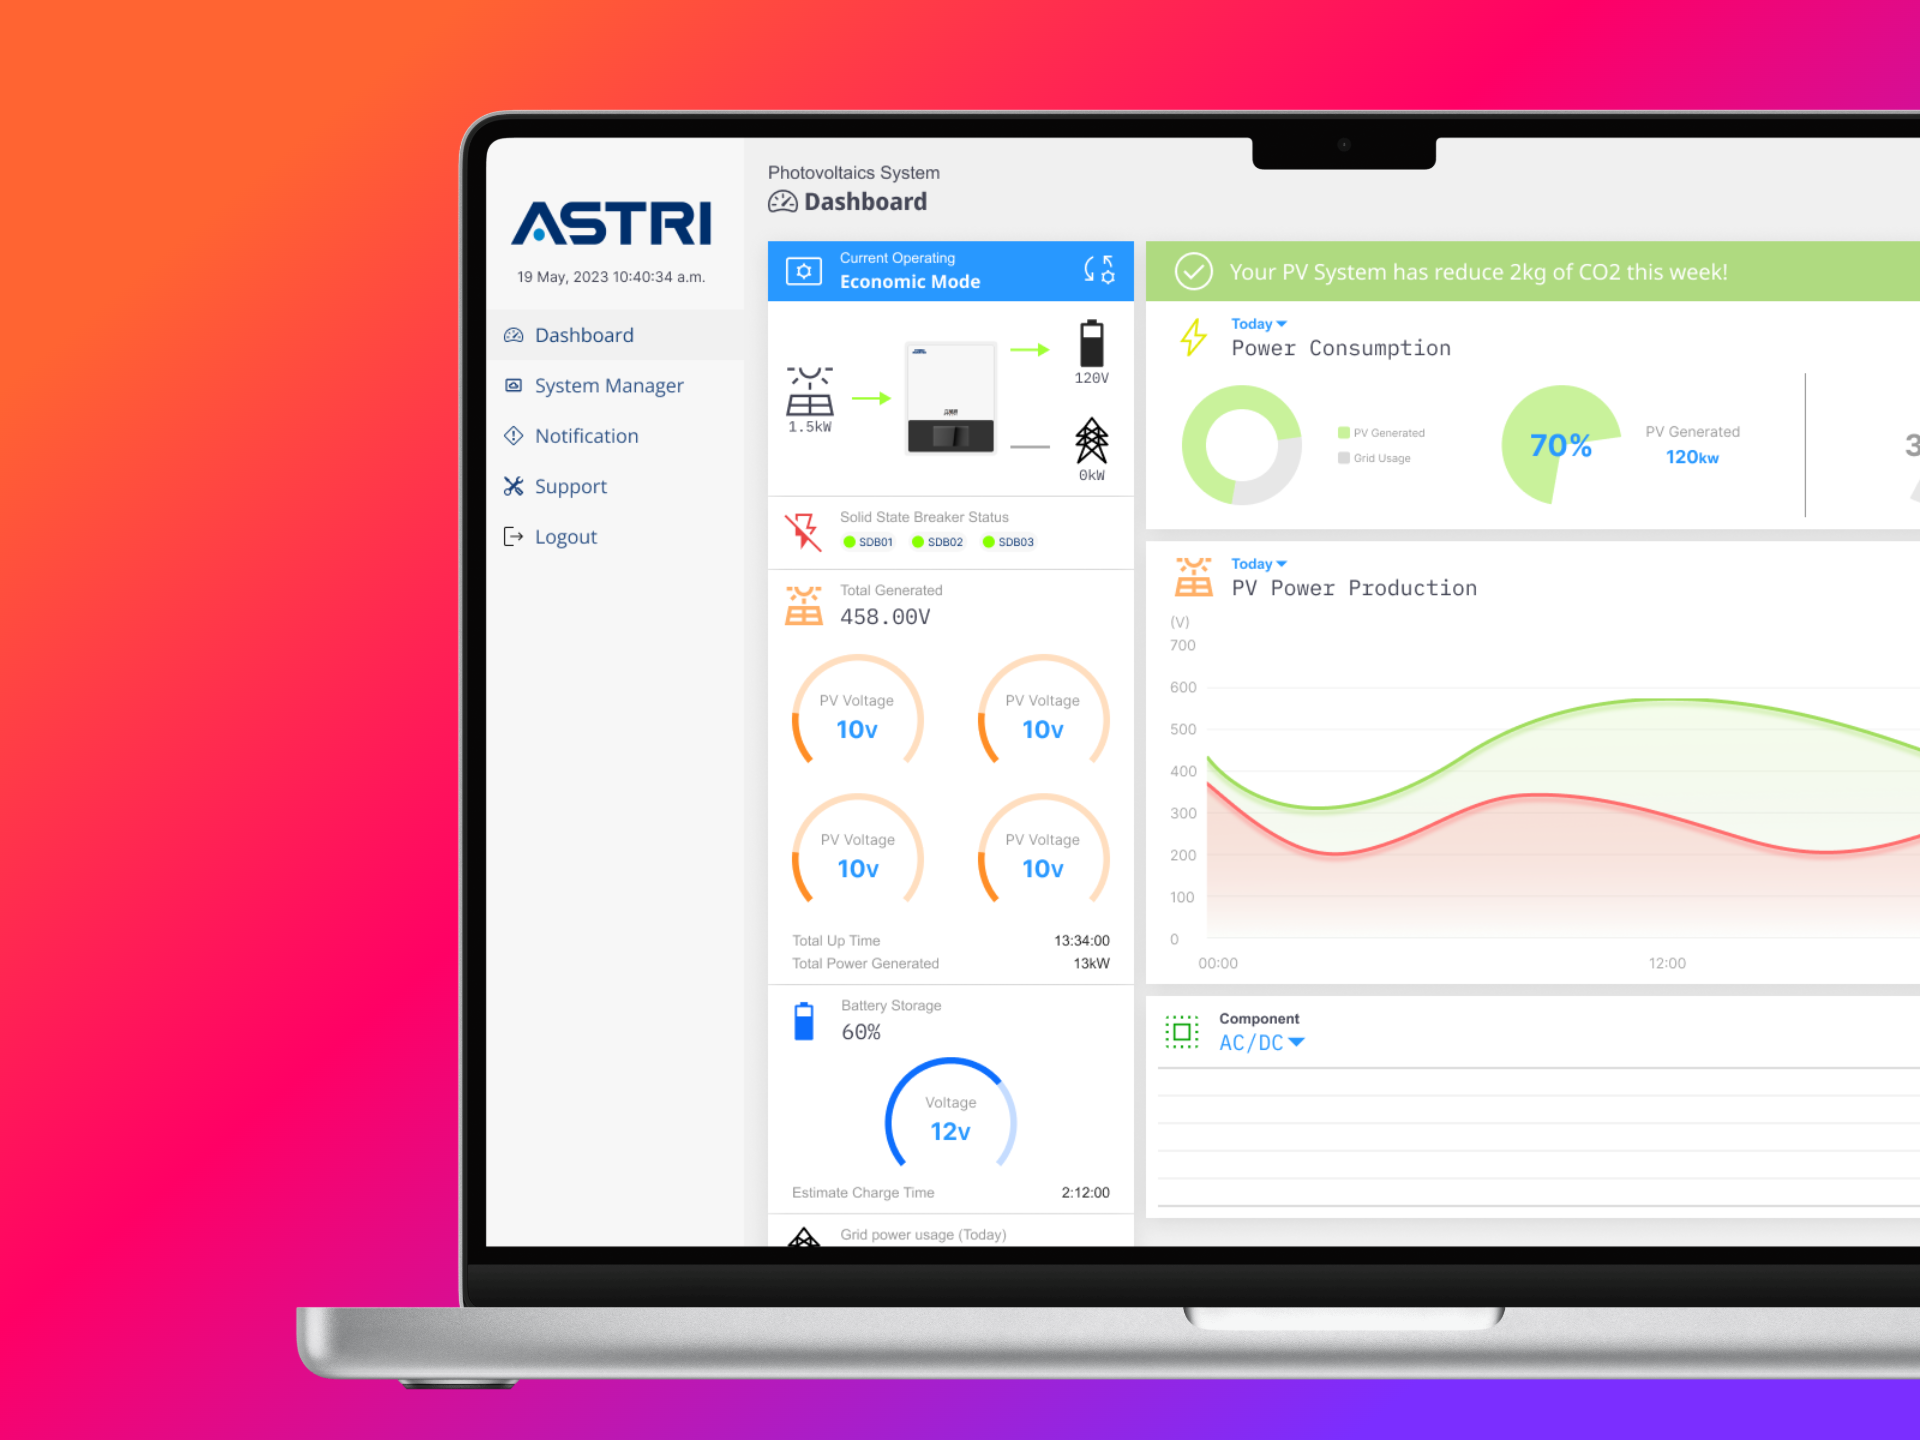
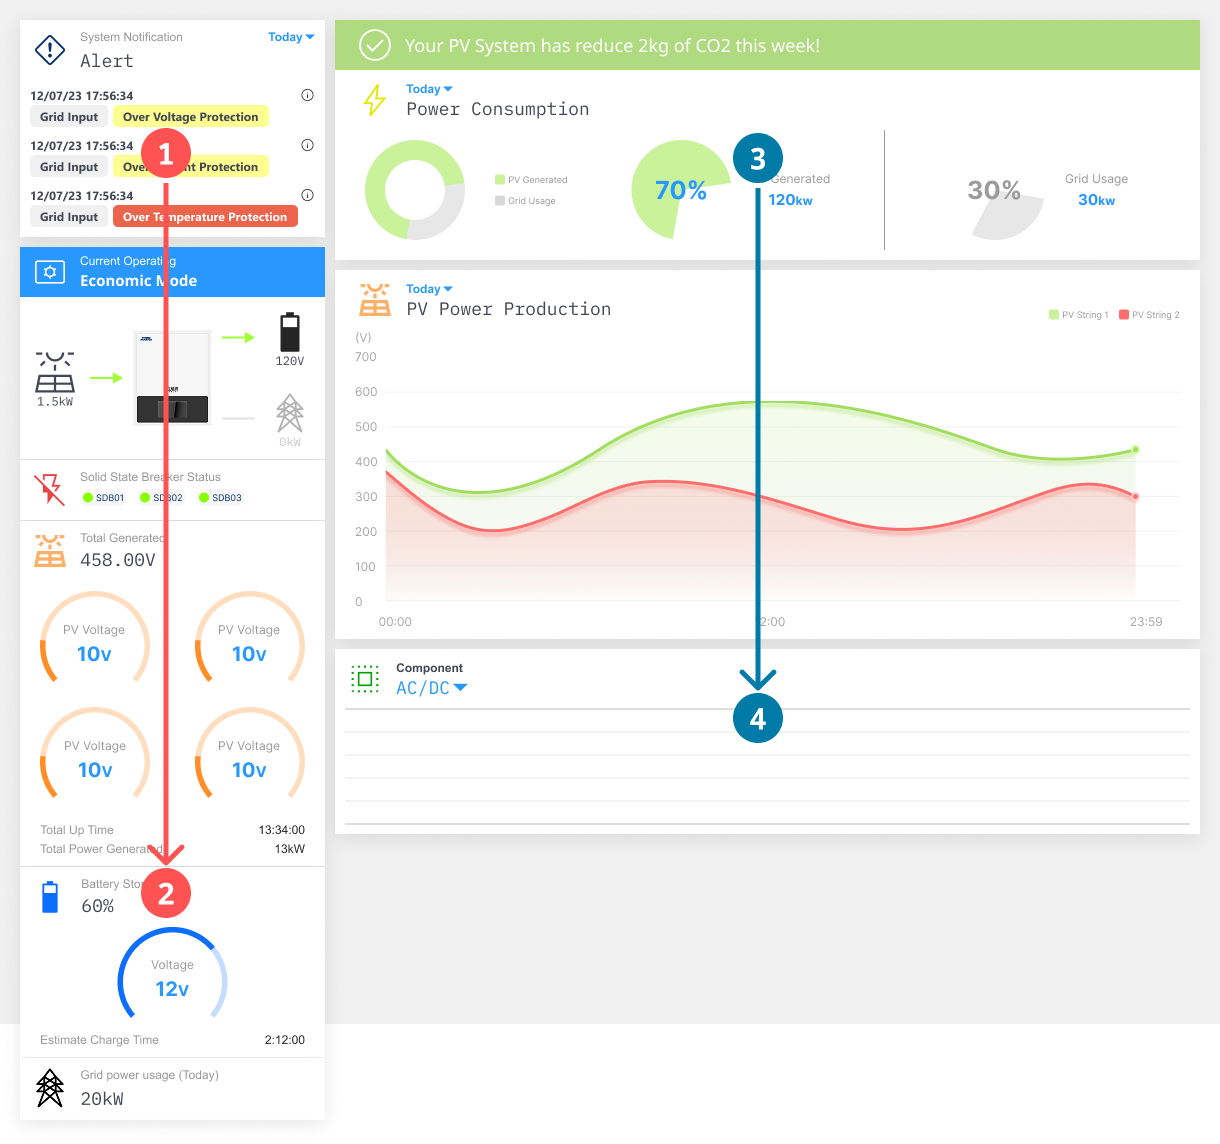
Sidebar serves as a high-priority vertical anchor, housing essential real-time status indicators—such as operating modes, battery storage, and system-wide alerts—to ensure critical data is the first thing an engineer sees.
Reduces Cognitive Load
By providing immediate feedback, you prevent users from clicking a button multiple times, which could lead to system errors in an IoT power environment.
Phase 4
Deliver (Implementation)
Prototyping
Built interactive prototypes integrated with live sensor data to simulate real-world scenarios and validate flows with engineers.
Testing & Iteration
Refined control placement, toggle behavior, and visual hierarchy based on qualitative feedback from usability tests.
Final Implementation
Delivered a responsive HMI (Human-Machine Interface) with clear component states and exposed device-level status for troubleshooting without cluttering the view.
Cross-Platform Consistency
Confirmed responsiveness across all devices, ensuring mobile and tablet layouts remained consistent with desktop feedback and hierarchy.